
You spent months running AI marketing tools, and now you are sitting in a budget review. You know things improved. You just cannot produce a number that finance will accept. That is not a measurement problem. It is a deployment timing problem: it started the day you turned the tool on without documenting where you were before. I have built measurement programs for large retail, BFSI, and FMCG brands at Hansa Cequity, where pre-campaign baseline documentation was a non-negotiable. Here is the framework that makes AI marketing ROI provable, and why it has to be built before deployment, not after.
Baseline Blindness Is Why Your AI ROI Stays Unprovable
The default approach to AI marketing ROI goes like this. The team evaluates a tool, signs a contract, and deploys it. The vendor dashboard shows promising numbers in the first few weeks. The plan is to review the data after a quarter and build the ROI case from there. The tool has reporting built in. Measurement can come later.
This is the approach most marketing teams take. It is also the approach that makes causal proof structurally impossible before the tool is ever turned on.
Most AI marketing ROI guides solve the wrong problem: they tell you how to measure results you already cannot prove because you deployed without a measurement architecture in place.
Proving that a tool caused an improvement requires a counterfactual: what would have happened if the tool had never run? That counterfactual only exists if you documented performance at a specific point in time before anything changed. Once the tool is live, that moment is gone. You can observe that conversions improved after the AI tool launched. You cannot isolate the tool’s contribution from a seasonal uptick, a new campaign that also launched, a competitor going quiet, or the simple fact that your team is paying more attention to a metric because it is now being actively measured. The AI vendor’s dashboard attributes results using its own model. That model is not your model and it is not independently verifiable.
Baseline Blindness: the state a marketing team enters when they deploy an AI marketing tool without documenting pre-AI performance metrics, making causal ROI proof permanently unavailable.
The AI marketing statistics confirm how widespread this failure is: fewer than a third of marketing leaders report a clear and measurable return from their AI investments. A BCG survey of 1,000 senior executives across 59 countries found that 74% of companies have yet to show tangible value from their AI investments. Most of them are not running bad tools. Most of them deployed without a baseline and are now trying to measure backward.
I saw this pattern repeat across dozens of enterprise accounts at Hansa Cequity. Every customer analytics engagement began with a dedicated baseline documentation phase before any campaign, model, or intervention went live. The reasoning was not academic: if you cannot establish what was happening before you changed anything, you cannot prove you changed anything. On one retail CRM programme, the client’s internal team had already been running A/B experiments for six weeks before we were brought in to document the baseline. Those six weeks of data were unusable for causal proof. The intervention was already active. The measurement window had already closed. That lesson repeated itself more times than I can count. The measurement problem is almost always a timing problem.
The fix has four components. First: document the current conversion rate on the primary metric the tool claims to influence, measured today. Second: document the current cost-per-outcome on that same metric. Third: record the current time-per-task for any workflow the tool will automate, in hours per week per person. Fourth: define a holdout group that will not receive the AI intervention from the moment the tool goes live. Without these four data points, you cannot prove anything the tool claims.
What the pre-deployment architecture looks like in practice is more specific than most teams expect. It does not require new tooling or a data science hire.
The Pre-Deployment Measurement Architecture
Teams that do think carefully before deploying an AI tool typically set SMART goals. “Improve email open rates by 20% in 90 days using AI personalisation.” This feels like a measurement plan. It is not. A SMART goal is a target. It tells you what you want to happen. A measurement architecture tells you how you will prove the AI caused it rather than everything else that moved during those 90 days.
The difference is the holdout. A holdout group is a defined segment of your audience that does not receive the AI intervention. They continue through the standard, non-AI version of whatever workflow you are testing. The treated group gets the AI version. After 60 or 90 days, you compare the two groups on the primary metric.
A goal without a holdout is a target, not proof.
Without the holdout, any improvement you observe is confounded by every variable that also changed during the measurement period: seasonality, offer changes, team attention, market conditions, competitive moves. The holdout strips those variables out. It is not a perfect methodology. It is the most accessible methodology available to teams without a full-time data science function, and it produces a number that finance will accept because the logic is auditable.
When I ran customer analytics programmes at Hansa Cequity, a 10% holdout was standard operating procedure on every CRM engagement. Not for methodological purity. Because without it, every client presentation became a debate about whether the results were real. With the holdout, the treated-versus-holdout delta was the proof. The conversation moved from “did this work?” to “what do we scale?”
The broader AI marketing analytics framework reinforces this approach: Google’s own measurement guidance recommends combining Marketing Mix Modeling, incrementality testing, and attribution as the multi-step setup that produces the highest confidence in marketing ROI. The holdout group is the accessible, team-scale version of the same principle.
Six data points to document before any AI marketing tool goes live:
- Current primary metric value. The specific metric the tool claims to influence, measured today, not as a historical average.
- 90-day rolling average on that metric. This removes point-in-time noise and gives you a stable baseline that accounts for normal fluctuation.
- Current cost-per-outcome. If the tool claims to reduce acquisition cost, you need today’s acquisition cost before it runs.
- Current time-per-task for any workflow the tool will automate. Measured in hours per week, per person, before the tool touches the workflow.
- A defined holdout group. Minimum 10% of your active audience, excluded from the AI intervention from the day the tool launches.
- A measurement review date. Set it before deployment. This is the date you will compare treated versus holdout results. If you do not set it in advance, it will not happen.
How to Build a Holdout Group Without a Data Science Team
Most email platforms and CRM systems allow you to create static segments. A holdout group is a static segment, created before launch, and left untouched throughout the measurement period.
The practical setup: in your email platform or CRM, create a segment containing 10% of your active audience by random sample. Tag it with the tool name and deployment date. Suppress this segment from every AI-driven workflow from launch day forward. They continue to receive standard, non-AI communications. Do not add new contacts to the segment after deployment. Do not remove anyone from it.
At the measurement date, run the same performance query against both populations: the treated group (everyone not in the holdout) and the holdout. The metric gap between the two is the number you take to your stakeholders.
One non-negotiable: the holdout must be defined and frozen before the AI tool launches. A holdout segment created after the tool has been live is already contaminated. It is not a clean control. If you are reading this after your AI tools are already running, skip to the closing section for what to do from today forward.
Once the architecture is in place, the question is which metrics to pursue first and in what order.
The Metric Stack: Time Savings First, Revenue Second
The standard AI marketing ROI approach starts with revenue. What incremental revenue did the AI tool generate? It feels like the right question. It is also the hardest question to answer cleanly, and starting with it almost always backfires.
Revenue attribution in a multi-channel environment requires a clean multi-touch model, a long enough measurement window for revenue to materialise, and a methodology robust enough to separate the AI tool’s contribution from every other variable running simultaneously. Teams that lead with revenue typically produce one of two outcomes: a vendor-attributed figure that finance immediately challenges, or no number at all because the data is too messy to be credible. Either way, the ROI conversation stalls before it starts.
Start with the number that requires no attribution model.
Time savings is that number. If an AI tool reduces content briefing from four hours to 45 minutes per piece, and a marketer runs 15 pieces per month, that is over 48 hours saved per month per person. At a fully loaded cost rate, that is a hard dollar figure. It requires no attribution model, no holdout comparison, and no multi-touch analysis. Finance understands it immediately because the inputs are auditable in an afternoon.
In my advisory work with growth-stage SaaS companies, I consistently recommend presenting the ROI case in three stages. Stage one: time savings, calculated from direct time-on-task measurement before and after deployment. Stage two: performance lift on one specific metric, compared against the holdout group. Stage three: revenue attribution, only once stages one and two have earned credibility with the decision-makers in the room.
The clients who try to skip to stage three almost always end up back at stage one after the first review meeting. Finance challenges the revenue figure. The presenter cannot defend the methodology. The meeting ends without approval. Restarting with time savings a month later produces a completely different conversation, not because the results changed but because the starting point is now auditable. B2B measurement research confirms the pattern: time saved on routine tasks is consistently the fastest and most defensible first ROI win in AI workflow integration, precisely because it does not depend on attribution.
The marketing automation with AI statistics provide useful benchmarks for typical efficiency gains by automation type, which helps you sanity-check your own time savings calculations before you present them.
Build the AI marketing ROI case as a three-stage stack. Present each stage in sequence and do not advance to the next until the previous has been accepted.
The Time Savings Formula Finance Will Accept
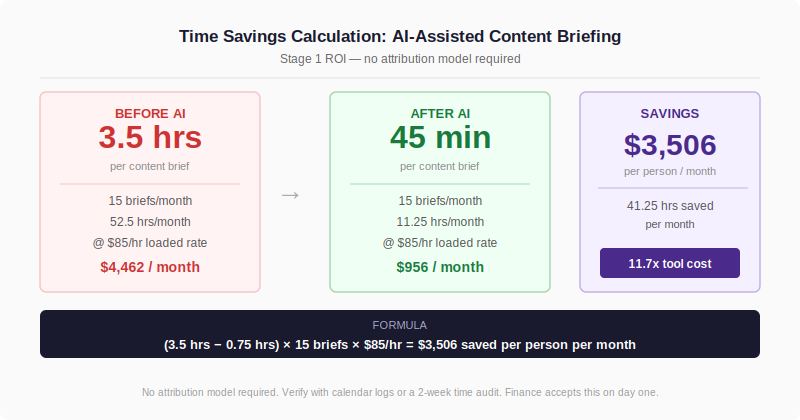
The formula: (Hours per task before AI minus hours per task after AI) multiplied by tasks per month, multiplied by fully loaded hourly cost rate.
A worked example. Before the AI-assisted briefing tool: content brief takes 3.5 hours. After: 45 minutes. Monthly task volume: 15 briefs. Fully loaded hourly cost rate: $85.
Time saved per task: 2.75 hours. Time saved per month: 2.75 x 15 = 41.25 hours. Dollar value: 41.25 x $85 = $3,506 per month, per person.
If the tool costs $300 per month, the time savings alone covers it more than eleven times over. Finance does not need to trust an attribution model to accept this. They need to trust the time-on-task measurement, which you can verify against calendar data, task logs, or a simple before-and-after time audit run over two weeks.
Time savings gets the ROI conversation started. The holdout comparison closes it.
Presenting AI Marketing ROI So Stakeholders Accept It
Most AI marketing ROI presentations open with the tool’s own dashboard metrics. Engagement rate is up. Content output has tripled. Personalisation scores have improved. The presenter is confident. The finance leader asks what the open rate was before the tool launched. The presenter does not have a clean answer. The meeting stalls.
Vendor dashboard metrics are not the same as independently measured incremental lift. Any senior finance leader who has worked with paid social, email platforms, or any martech tool with built-in reporting has seen attribution inflation. Platforms attribute their own contribution generously. The finance leader’s skepticism is not about your AI tool. It is about the methodology. Presenting vendor numbers without a parallel independent measurement is presenting a result without a denominator. No comparison baseline means no proof of causality. The number could reflect genuine AI-driven lift or a market that was improving anyway.
At Hansa Cequity, the standard format for every client ROI presentation was a dual-column performance summary: treated cohort results alongside holdout cohort results, measured over the same period. The delta between the two was the only number we presented as the programme’s direct contribution. We did not present the overall campaign numbers. We presented the gap.
For one retail loyalty re-engagement campaign, the treated group showed a 45% re-purchase rate over the measurement period. The holdout showed 31%. The delta was 14 percentage points attributable to the programme. The same campaign’s performance against the prior period looked like a 6-point improvement. The difference was seasonal uplift. Without the holdout, six of those 14 points were being attributed to the campaign when they were the result of a market-wide trend. The holdout stripped the noise out. The 14-point figure was what we presented. Finance accepted it without pushback, because the methodology was visible and the counterfactual was right there in the same table.
If your stakeholders want to benchmark that number against category norms, the marketing benchmarking statistics provide category-level reference data for those comparisons. A Gartner survey of 418 marketing leaders found that many CMOs feel their GenAI investments have yet to pay off, which means a credible proof methodology is not just useful internally. It is the differentiator when your competitors cannot show the same.
If the baseline is missing, do not present the number.
Structure every AI marketing ROI presentation in three columns: baseline, result, and delta. The baseline is either the pre-AI metric or the holdout group’s performance over the same measurement period. The result is the treated group. The delta is the difference, expressed as a percentage change and as a dollar value calculated on the cohort size.
Never present the result column alone. If you do not have a baseline, do not present a number. Present the measurement methodology you are now running and the date when you will have a comparison. A credible methodology statement builds more trust with finance than a contested result. It shows you know how measurement works, which is the actual confidence signal they are looking for.
Where to Start If Your Tools Are Already Live
If you are reading this after deploying AI tools without a baseline, the measurement window for proving causality on past results is largely closed. Here is what to do from today forward.
- List every AI marketing tool currently running in your stack. For each one, write down the primary metric it claims to influence. If you cannot name the primary metric, that tool’s ROI case does not yet exist, and you need to define it before anything else.
- Pull 90-day pre-deployment data for each primary metric. If the tools have been live for less than 90 days, you may still have clean pre-deployment data. If they have been live longer and you have no pre-deployment records, document today’s performance on all primary metrics. This becomes the baseline for your next measurement cycle.
- Check whether a holdout group exists for any currently running tool. If not, create one today. Segment a 10% random sample of your audience out of every AI-driven workflow from this point forward. This is not ideal. The tool has already been running. But it produces clean forward-looking data starting now, and a 60-day holdout comparison is far more defensible than no holdout at all.
- Build the time savings calculation for each AI tool using the formula in this article. Present this number first in your next stakeholder review. Do not lead with revenue attribution until the time savings figure has been accepted and the methodology has earned credibility.
- Set a measurement review date 90 days from today. On that date, run the treated-versus-holdout comparison for every tool with an active holdout. That delta is your provable AI marketing ROI.
Read next: AI Marketing Analytics guide